PDF下载 ( 791 KB)

尿液铊与非酒精性脂肪性肝病的相关性分析
DOI: 10.12449/JCH240408
-
摘要:
目的 探讨尿液铊(TL)与非酒精性脂肪性肝病(NAFLD)的关系。 方法 选取2017—2020年美国健康与营养检查调查数据(NHANES)中年龄≥18岁的注册参与者,并排除缺乏肝脏瞬时弹性成像数据、尿液TL指标及患有乙型肝炎、丙型肝炎、饮酒量显著的人群。将纳入人群分为NAFLD组和Non-NAFLD组,采用高效液相色谱-电喷雾电离-串联质谱和在线固相萃取联合同位素稀释等方法定量检测尿液TL水平,比较两组人群年龄、性别、种族、婚姻状况、教育、家庭收入与贫困比比值(FMPIR)、体质量指数(BMI)、吸烟、喝酒、糖尿病(DM)、高血压(HTN)、高脂血症(HL)、尿液TL水平。计量资料两组间比较采用成组t检验或Wilicoxon秩和检验;计数资料两组间比较采用χ2检验。通过描述性分析、多因素Logistic回归、限制性三次样条回归分析、亚组分析、交互作用,探究尿液TL与NAFLD的风险关联。 结果 共纳入2 511例,NAFLD组1 612例(64.20%),Non-NAFLD组899例(35.80%),NAFLD组尿液TL水平明显高于Non-NAFLD组,差异具有统计学意义[0.18(0.11~0.26)μg/L vs 0.16(0.09~0.25)μg/L,Z=-2.76,P=0.01]。调整年龄、性别、种族、教育、婚姻状况、FMPIR、BMI、吸烟、喝酒、DM、HTN、HL协变量后,尿液TL Q4组[比值比(OR)=1.90,95%CI:1.48~2.44]患NAFLD风险显著增加(P<0.01)。尿液TL与患NAFLD的风险存在正向剂量-反应关系(P<0.01)且为非线性关系(P<0.01)。尿液TL与吸烟、BMI之间存在显著的交互作用(P<0.05),一生吸烟≥100支的人群尿液TL每上升一个四分位数患NAFLD的风险增加50%(OR=1.50,95%CI:1.24~1.80),一生吸烟<100支的人群尿液TL每上升一个四分位数患NAFLD的风险增加20%(OR=1.20,95%CI:1.03~1.40),BMI≥30 kg/m2的人群尿液TL每上升一个四分位数患NAFLD的风险增加30%(OR=1.30,95%CI:1.05~1.70),差异具有统计学意义(P<0.05)。 结论 尿液TL水平与患NAFLD的风险显著相关。 Abstract:Objective To investigate the association between urinary thallium (TL) and nonalcoholic fatty liver disease (NAFLD). Methods Related data were collected from the registered participants aged ≥18 years in National Health and Nutrition Examination Survey from 2017 to 2020, with th exclusion of the individuals with a lack of liver transient elastography data and urinary TL indicators and those with hepatitis B, hepatitis C or significant alcohol consumption. A total of individuals were divided into NAFLD group and non-NAFLD group. Urinary TL level was quantitatively measured using high-performance liquid chromatography-electrospray ionization-tandem mass spectrometry and online solid-phase extraction combined with isotope dilution. The two groups were compared in terms of age, sex, race, marital status, education, family income poverty impact ratio (FMPIR), body mass index (BMI), smoking, alcohol consumption, diabetes mellitus (DM), hypertension (HTN), hyperlipidemia (HL), and urinary TL level. The independent-samples t test or the Wilcoxon rank-sum test was used for comparison of continuous data between two groups, and the chi-square test was used for comparison of categorical data between two groups. Descriptive analysis, multivariable Logistic regression, restricted cubic spline regression analysis, subgroup analysis, and interaction analysis were conducted to investigate the risk association between urinary TL and NAFLD. Results A total of 2 511 individuals were included, with 1 612 (64.20%) in the NAFLD group and 899 (35.80%) in the non-NAFLD group, and the NAFLD group had a significantly higher urinary TL level than the non-NAFLD group [0.18 (0.11 — 0.26)μg/L vs 0.16 (0.09 — 0.25)μg/L, Z=-2.76, P=0.01]. After adjustment for the covariates of age, sex, race, education, marital status, FMPIR, BMI, smoking, alcohol consumption, DM, HTN, and HL, the urinary TL Q4 group had a significant increase in the risk of NAFLD (odds ratio [OR]=1.90, 95% confidence interval [CI]: 1.48 — 2.44, P<0.01). There was a positive dose-response relationship (P<0.01) and a non-linear relationship (P<0.01) between urinary TL and the risk of NAFLD. A significant interaction was observed between urinary TL and smoking/BMI (P<0.05). For individuals taking ≥100 cigarettes in their lifetime, the risk of NAFLD was increased by 50% for every quartile increase in urinary TL (OR=1.50, 95%CI: 1.24 — 1.80), and for individuals taking<100 cigarettes in their lifetime, the risk of NAFLD was increased by 20% for every quartile increase in urinary TL (OR=1.20, 95%CI: 1.03 — 1.40); for individuals with a BMI of ≥30 kg/m2, the risk of NAFLD was increased by 30% for every quartile increase in urinary TL (OR=1.30, 95%CI: 1.05 — 1.70), with a statistical significance (P<0.05). Conclusion Urinary TL level is significantly associated with the risk of NAFLD. -
Key words:
- Non-alcoholic Fatty Liver Disease /
- Thallium /
- Correlation of Data
-
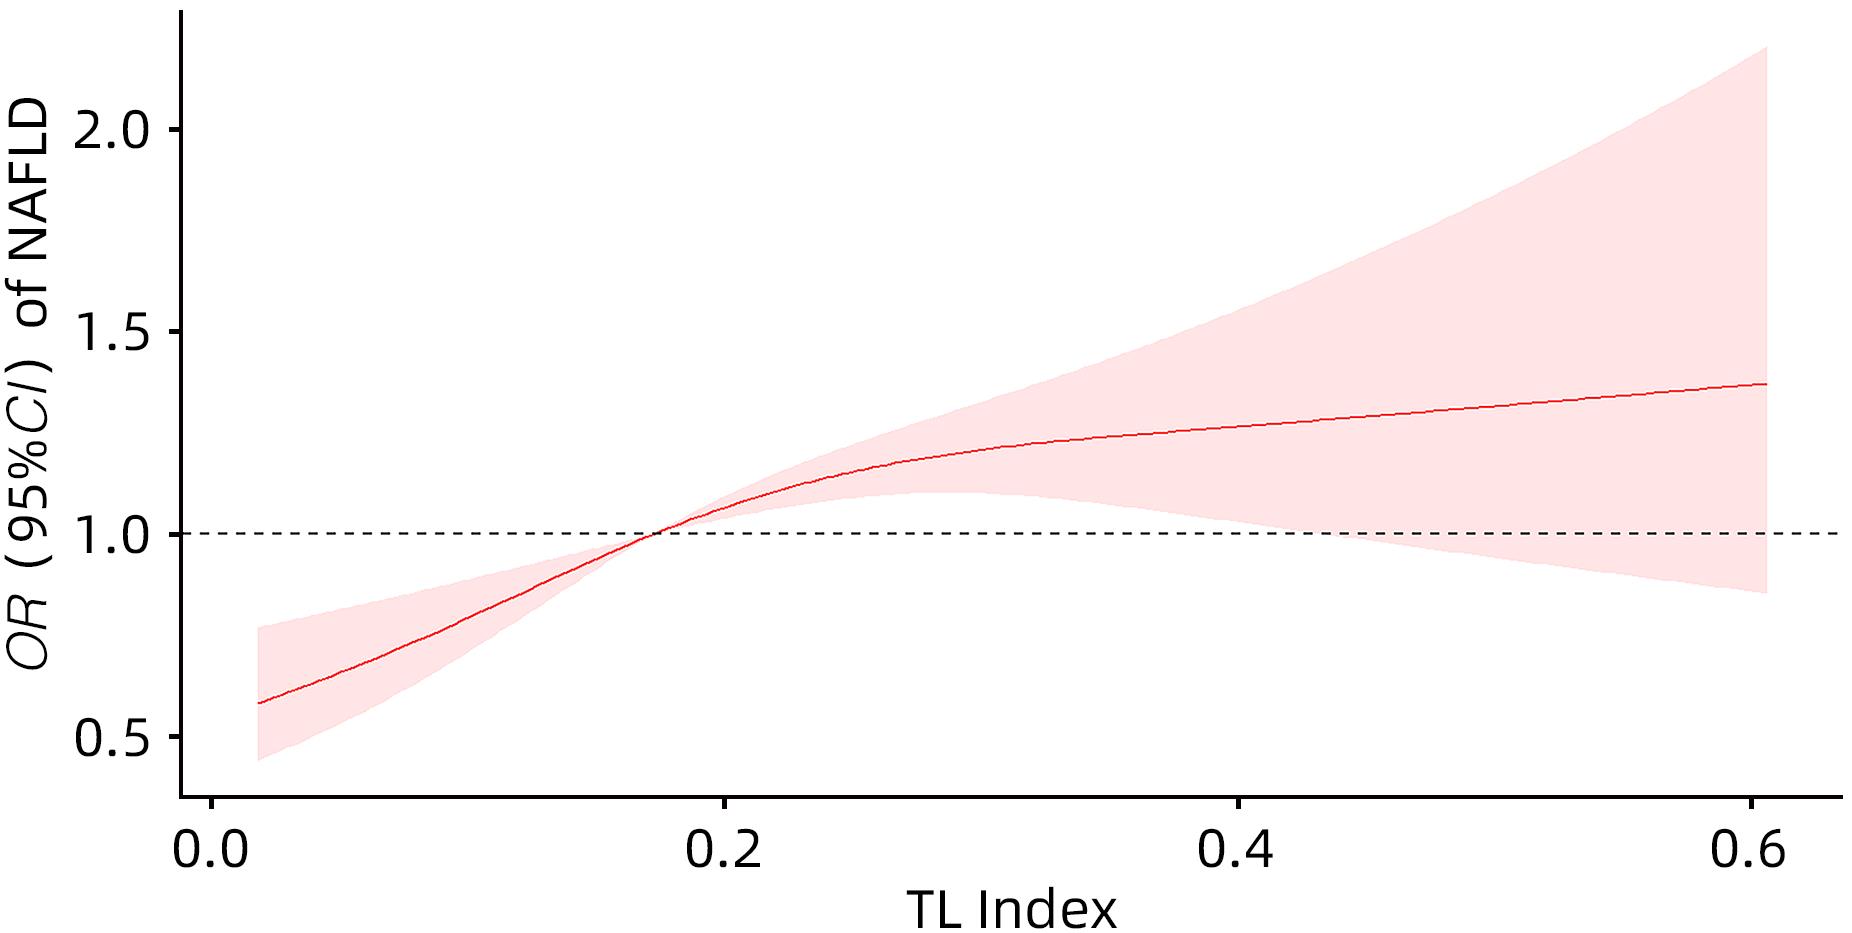
图 2 尿液TL与NAFLD之间的剂量-反应关系
Figure 2. Dose-response relationship between urinary TL and NAFLD
表 1 研究对象基本特征
Table 1. Basic characteristics of research objects
变量 总人数(n=2 511) Non-NAFLD组(n=899) NAFLD组(n=1 612) 统计值 P值 年龄(岁) 51(34~64) 42(28~61) 54(40~65) Z=-4.55 <0.01 年龄分组[例(%)] χ2=23.22 <0.01 18~39岁 822(32.74) 419(46.61) 403(25.00) 40~59岁 806(32.10) 220(24.47) 586(36.35) ≥60岁 883(35.17) 260(28.92) 623(38.65) 性别[例(%)] χ2=10.63 <0.01 女 1 262(50.26) 491(54.62) 771(47.83) 男 1 249(49.74) 408(45.38) 841(52.17) 种族[例(%)] χ2=20.94 <0.01 墨西哥裔美国人 326(12.98) 88(9.79) 238(14.76) 非西班牙裔黑人 672(26.76) 279(31.03) 393(24.38) 非西班牙裔白人 828(32.97) 288(32.04) 540(33.50) 其他 685(27.28) 244(27.14) 441(27.36) 教育[例(%)] χ2=1.85 0.26 大专或以上学历 1 371(54.60) 501(55.73) 870(53.97) 高中或同等学历 666(26.52) 241(26.81) 425(26.36) 高中以下 474(18.88) 157(17.46) 317(19.67) 吸烟[例(%)] χ2=0.08 0.82 一生吸烟<100支 1 502(59.82) 541(60.18) 961(59.62) 一生吸烟≥100支 1 009(40.18) 358(39.82) 651(40.38) 婚姻状况[例(%)] χ2=24.41 <0.01 已婚/与伴侣同居 1 450(57.75) 485(53.95) 965(59.86) 从来没有结过婚 527(20.99) 237(26.36) 290(17.99) 丧偶/离婚/分居 534(21.27) 177(19.69) 357(22.15) 喝酒[例(%)] χ2=10.66 <0.01 否 277(11.03) 120(13.35) 157(9.74) 是 2 234(88.97) 779(86.65) 1 455(90.26) FMPIR 2.26(1.17~4.14) 2.19(1.16~4.14) 2.32(1.17~4.15) Z=-0.99 0.34 BMI(kg/m2) 28.40(24.55~33.75) 24.60(21.60~27.90) 30.85(27.10~35.80) Z=-24.99 <0.01 BMI分组[例(%)] χ2=76.56 <0.01 BMI<25 kg/m2 685(27.28) 477(53.06) 208(12.90) BMI≥30 kg/m2 1 031(41.06) 138(15.35) 893(55.40) 25 kg/m2≤BMI<30 kg/m2 795(31.66) 284(31.59) 511(31.70) HTN[例(%)] χ2=18.44 <0.01 否 2 077(82.72) 770(85.65) 1 307(81.08) 是 434(17.28) 129(14.35) 305(18.92) HL[例(%)] χ2=51.83 <0.01 否 2 223(88.53) 851(94.66) 1 372(85.11) 是 288(11.47) 48(5.34) 240(14.89) DM[例(%)] χ2=67.38 <0.01 否 2 163(86.14) 852(94.77) 1 311(81.33) 是 348(13.86) 47(5.23) 301(18.67) 尿液TL(μg/L) 0.17(0.10~0.26) 0.16(0.09~0.25) 0.18(0.11~0.26) Z=-2.76 0.01  下载: 导出CSV
表 2 尿液TL与NAFLD的Logistic分析
Table 2. Logistic analysis of urinary TL and NAFLD
变量 Model 1 P值 Model 2 P值 Model 3 P值 OR(95%CI) OR(95%CI) OR(95%CI) 尿液TL 1.13(1.02~1.25) 0.03 1.29(1.15~1.44) <0.01 1.30(1.16~1.46) <0.01 尿液TL(人数/构成比) Q1(682/27.16%) Q2(631/25.13%) 1.21(0.97~1.50) 0.10 1.29(1.03~1.62) 0.03 1.29(1.02~1.63) 0.03 Q3(648/25.81%) 1.28(1.02~1.61) 0.03 1.48(1.17~1.87) <0.01 1.52(1.20~1.94) <0.01 Q4(550/21.90%) 1.36(1.08~1.71) 0.01 1.86(1.46~2.39) <0.01 1.90(1.48~2.44) <0.01
下载: 导出CSV
表 3 尿液TL与NAFLD的亚组分析及交互作用
Table 3. Subgroup analysis and interaction effect of urinary TL and NAFLD
变量 OR(95%CI) P值 交互作用P值 年龄分组 0.58 18~39岁 1.22(1.09~1.36) <0.01 40~59岁 1.44(1.15~1.81) <0.01 ≥60岁 1.09(0.91~1.31) 0.36 性别 0.34 男 1.35(1.13~1.60) <0.01 女 1.28(1.09~1.50) <0.01 种族 0.25 墨西哥裔美国人 1.44(1.01~2.06) 0.04 非西班牙裔黑人 1.33(1.07~1.66) 0.01 非西班牙裔白人 1.41(1.15~1.72) <0.01 其他 1.12(0.89~1.41) 0.34 教育 0.74 高中以下 1.45(1.09~1.93) 0.01 高中或同等学历 1.22(0.99~1.51) 0.06 大专或以上学历 1.32(1.13~1.54) <0.01 婚姻状况 0.90 已婚/与伴侣同居 1.30(1.12~1.51) <0.01 从来没有结过婚 1.42(1.08~1.88) 0.01 丧偶/离婚/分居 1.22(0.95~1.57) 0.11 FMPIR 0.14 <1.30 1.40(1.14~1.73) <0.01 1.30≤FMPIR<3.50 1.31(1.08~1.59) 0.01 ≥3.50 1.18(0.97~1.44) 0.10 BMI分组 0.02 <25 kg/m2 1.00(0.78~1.27) 0.37 ≥30 kg/m2 1.30(1.05~1.70) 0.04 25 kg/m2≤BMI<30 kg/m2 1.20(0.97~1.48) 0.09 吸烟 0.03 一生吸烟≥100支 1.50(1.24~1.80) <0.01 一生吸烟<100支 1.20(1.03~1.40) 0.02 喝酒 0.65 是 1.30(1.15~1.47) <0.01 否 1.28(0.91~1.80) 0.15 DM 0.16 是 1.64(1.01~2.64) 0.04 否 1.29(1.15~1.46) <0.01 HTN 0.37 是 1.23(0.94~1.62) 0.14 否 1.32(1.16~1.50) <0.01 HL 0.14 是 1.36(0.86~2.14) 0.19 否 1.30(1.15~1.46) <0.01
下载: 导出CSV
-
[1] CHALASANI N, YOUNOSSI Z, LAVINE JE, et al. The diagnosis and management of nonalcoholic fatty liver disease: Practice guidance from the American Association for the Study of Liver Diseases[J]. Hepatology, 2018, 67( 1): 328- 357. DOI: 10.1002/hep.29367. [2] YOUNOSSI ZM, KOENIG AB, ABDELATIF D, et al. Global epidemiology of nonalcoholic fatty liver disease-Meta-analytic assessment of prevalence, incidence, and outcomes[J]. Hepatology, 2016, 64( 1): 73- 84. DOI: 10.1002/hep.28431. [3] ESTES C, RAZAVI H, LOOMBA R, et al. Modeling the epidemic of nonalcoholic fatty liver disease demonstrates an exponential increase in burden of disease[J]. Hepatology, 2018, 67( 1): 123- 133. DOI: 10.1002/hep.29466. [4] QUEK J, CHAN KE, WONG ZY, et al. Global prevalence of non-alcoholic fatty liver disease and non-alcoholic steatohepatitis in the overweight and obese population: A systematic review and meta-analysis[J]. Lancet Gastroenterol Hepatol, 2023, 8( 1): 20- 30. DOI: 10.1016/S2468-1253(22)00317-X. [5] CALZADILLA BERTOT L, ADAMS LA. The natural course of non-alcoholic fatty liver disease[J]. Int J Mol Sci, 2016, 17( 5): 774. DOI: 10.3390/ijms17050774. [6] WANG J, WANG LL, WANG YX, et al. Emerging risks of toxic metal(loid)s in soil-vegetables influenced by steel-making activities and isotopic source apportionment[J]. Environ Int, 2021, 146: 106207. DOI: 10.1016/j.envint.2020.106207. [7] RADIĆ S, CVJETKO P, GLAVAS K, et al. Oxidative stress and DNA damage in broad bean(Vicia faba L.) seedlings induced by thallium[J]. Environ Toxicol Chem, 2009, 28( 1): 189- 196. DOI: 10.1897/08-188.1. [8] MOTA M, BANINI BA, CAZANAVE SC, et al. Molecular mechanisms of lipotoxicity and glucotoxicity in nonalcoholic fatty liver disease[J]. Metabolism, 2016, 65( 8): 1049- 1061. DOI: 10.1016/j.metabol.2016.02.014. [9] PETER AL, VIRARAGHAVAN T. Thallium: A review of public health and environmental concerns[J]. Environ Int, 2005, 31( 4): 493- 501. DOI: 10.1016/j.envint.2004.09.003. [10] SÁNCHEZ-CHAPUL L, SANTAMARÍA A, ASCHNER M, et al. Thallium-induced DNA damage, genetic, and epigenetic alterations[J]. Front Genet, 2023, 14: 1168713. DOI: 10.3389/fgene.2023.1168713. [11] SHEKA AC, ADEYI O, THOMPSON J, et al. Nonalcoholic steatohepatitis: A review[J]. JAMA, 2020, 323( 12): 1175- 1183. DOI: 10.1001/jama.2020.2298. [12] JOHNSON CL, PAULOSE-RAM R, OGDEN CL, et al. National health and nutrition examination survey: Analytic guidelines, 1999-2010[J]. Vital Health Stat 2, 2013( 161): 1- 24. [13] ZHANG KW, NULALI J, ZHANG CX, et al. The association between serum vitamin A and NAFLD among US adults varied in different BMI groups: A cross-sectional study[J]. Food Funct, 2023, 14( 2): 836- 844. DOI: 10.1039/d2fo02204d. [14] PENG HY, PAN L, RAN SM, et al. Prediction of MAFLD and NAFLD using different screening indexes: A cross-sectional study in U.S. adults[J]. Front Endocrinol, 2023, 14: 1083032. DOI: 10.3389/fendo.2023.1083032. [15] CHEN XY, TIAN F, WU JF, et al. Associations of phthalates with NAFLD and liver fibrosis: A nationally representative cross-sectional study from NHANES 2017 to 2018[J]. Front Nutr, 2022, 9: 1059675. DOI: 10.3389/fnut.2022.1059675. [16] PARK E, KIM J, KIM B, et al. Association between environmental exposure to cadmium and risk of suspected non-alcoholic fatty liver disease[J]. Chemosphere, 2021, 266: 128947. DOI: 10.1016/j.chemosphere.2020.128947. [17] CHEN C, ZHOU Q, YANG RY, et al. Copper exposure association with prevalence of non-alcoholic fatty liver disease and insulin resistance among US adults(NHANES 2011-2014)[J]. Ecotoxicol Environ Saf, 2021, 218: 112295. DOI: 10.1016/j.ecoenv.2021.112295. [18] WANG X, SEO YA, PARK SK. Serum selenium and non-alcoholic fatty liver disease(NAFLD) in U.S. adults: National Health and Nutrition Examination Survey(NHANES) 2011-2016[J]. Environ Res, 2021, 197: 111190. DOI: 10.1016/j.envres.2021.111190. [19] LIU J, TAN L, LIU ZY, et al. Blood and urine manganese exposure in non-alcoholic fatty liver disease and advanced liver fibrosis: An observational study[J]. Environ Sci Pollut Res Int, 2023, 30( 9): 22222- 22231. DOI: 10.1007/s11356-022-23630-4. [20] LI D, YAO H, DU L, et al. Thallium(I and III) exposure leads to liver damage and disorders of fatty acid metabolism in mice[J]. Chemosphere, 2022, 307( Pt 1): 135618. DOI: 10.1016/j.chemosphere.2022.135618. [21] CHEN RS, XU Y, XU C, et al. Associations between mercury exposure and the risk of nonalcoholic fatty liver disease(NAFLD) in US adolescents[J]. Environ Sci Pollut Res Int, 2019, 26( 30): 31384- 31391. DOI: 10.1007/s11356-019-06224-5. [22] ASPROULI E, KALAFATI IP, SAKELLARI A, et al. Evaluation of plasma trace elements in different stages of nonalcoholic fatty liver disease[J]. Biol Trace Elem Res, 2019, 188( 2): 326- 333. DOI: 10.1007/s12011-018-1432-9. [23] NGUYEN HD, KIM MS. Cadmium, lead, and mercury mixtures interact with non-alcoholic fatty liver diseases[J]. Environ Pollut, 2022, 309: 119780. DOI: 10.1016/j.envpol.2022.119780. [24] FREDIANI JK, NAIOTI EA, VOS MB, et al. Arsenic exposure and risk of nonalcoholic fatty liver disease(NAFLD) among U.S. adolescents and adults: An association modified by race/ethnicity, NHANES 2005-2014[J]. Environ Health, 2018, 17( 1): 6. DOI: 10.1186/s12940-017-0350-1. [25] HYDER O, CHUNG M, COSGROVE D, et al. Cadmium exposure and liver disease among US adults[J]. J Gastrointest Surg, 2013, 17( 7): 1265- 1273. DOI: 10.1007/s11605-013-2210-9. [26] HUH JH, LEE KJ, LIM JS, et al. High dietary sodium intake assessed by estimated 24-h urinary sodium excretion is associated with NAFLD and hepatic fibrosis[J]. PLoS One, 2015, 10( 11): e0143222. DOI: 10.1371/journal.pone.0143222. [27] DUAN WX, WANG YY, LI ZQ, et al. Thallium exposure at low concentration leads to early damage on multiple organs in children: A case study followed-up for four years[J]. Environ Pollut, 2020, 258: 113319. DOI: 10.1016/j.envpol.2019.113319. [28] KOROTKOV SM, LAPIN AV. Thallium induces opening of the mitochondrial permeability transition pore in the inner membrane of rat liver mitochondria[J]. Dokl Biochem Biophys, 2003, 392: 247- 252. DOI: 10.1023/a:1026182511897. [29] ESKANDARI MR, MASHAYEKHI V, ASLANI M, et al. Toxicity of thallium on isolated rat liver mitochondria: The role of oxidative stress and MPT pore opening[J]. Environ Toxicol, 2015, 30( 2): 232- 241. DOI: 10.1002/tox.21900. [30] TANG P, LIAO Q, TANG Y, et al. Independent and combined associations of urinary metals exposure with markers of liver injury: Results from the NHANES 2013-2016[J]. Chemosphere, 2023, 338: 139455. DOI: 10.1016/j.chemosphere.2023.139455. -

 本文二维码
本文二维码
计量
- 文章访问数: 941
- HTML全文浏览量: 265
- PDF下载量: 121
- 被引次数: 0